Material Science 1st Module
Atomic Diffusion
The Migration of atom from their original lattice sites in a crystal structure to other sites is known as Diffusion
Diffusion involves the movement of atoms ions or molecules from one position to another position and occurs mainly due to thermal agitation or the presence of concentration gradients.
Fick's I Law of Diffusion
It states that, the flux of atoms J moving across a unit surface area in unit time is proportional to the concentration gradient dc/dx. Under steady state flow,

where,
J = No of atoms/unit area of diffusion per unit time (atoms/m2 sec)C = Volume concentration of atoms (atoms/m3)
X = Distance between the planes in the direction of flow of atoms (m) D= diffusion co-efficient or diffusivity (m2/sec)
-ve sign = indication that flux moves from higher to lower concentration.
Fick’s II Law of Diffusion
This law relates to the rate of change in concentration with time. This non-steady state condition is represented by a second order differential equation.

Fick's II law is also stated as,
"the rate of compositional change is equal to the diffusivity times the rate ofchange of the concentration gradient".
Diffusivity
Diffusivity or the co-efficient of diffusion (D) is defined as the amount of substance diffusing in unit time across a unit area through a unit concentration gradient and its unit is m2/sec
The co-efficient of diffusion of various materials vary with crystal structure and temperature. Factors affecting Diffusion –
1) Temperature: High temperature provides the necessary activation energy to the atoms to begin diffusion. So, a higher temperature initiates diffusion faster.
2) Crystal Structure: If a crystal structure is distorted, i.e., if there are more imperfections, the rate of diffusion is increased
3) Atomic Packing Factor: If APF is high, the rate of diffusion will be decreased. Diffusion is much slower in FCC-iron than in BCC-iron.
4) Grain Boundaries: The diffusion process proceeds more rapidly along the grain boundaries since it is a zone of crystal imperfections.
5) Grain Size: Since diffusion through grain boundaries is faster than through the grains themselves, a material with finer grains will have a faster rate of diffusion.
6) Atomic Size: Diffusion occurs more readily when the size of the diffusing atom is less. Ex: Carbon in iron
7) Concentration Gradient: Higher the concentration gradient higher will be the rate of diffusion.
Plastic deformation by Slip and Twinning Plastic Deformation
If the solid body is loaded beyond the elastic limit, the body will experience a permanent change in its shape and size, even if the load is removed.
This is known as the Plastic behavior of materials. A body which is permanently deformed is said to have undergone Plastic Deformation.
Plastic Deformation of Single Crystals
A single crystal is nothing but a single grain and hence has no grain boundaries example- a whisker grown under special conditions.
A number of such grains come together to forma polycrystalline material and there are grain boundaries between adjacent crystals
Plastic deformation of single crystals involves the study of one single crystal and observing how it behaves under stress
Plastic deformation in single crystals may take place by (i) Slip
(ii) Twinning or
(iii) Combination of both
i) Plastic deformation by SLIP:
Slip is the most common mode of plastic deformation among crystals.
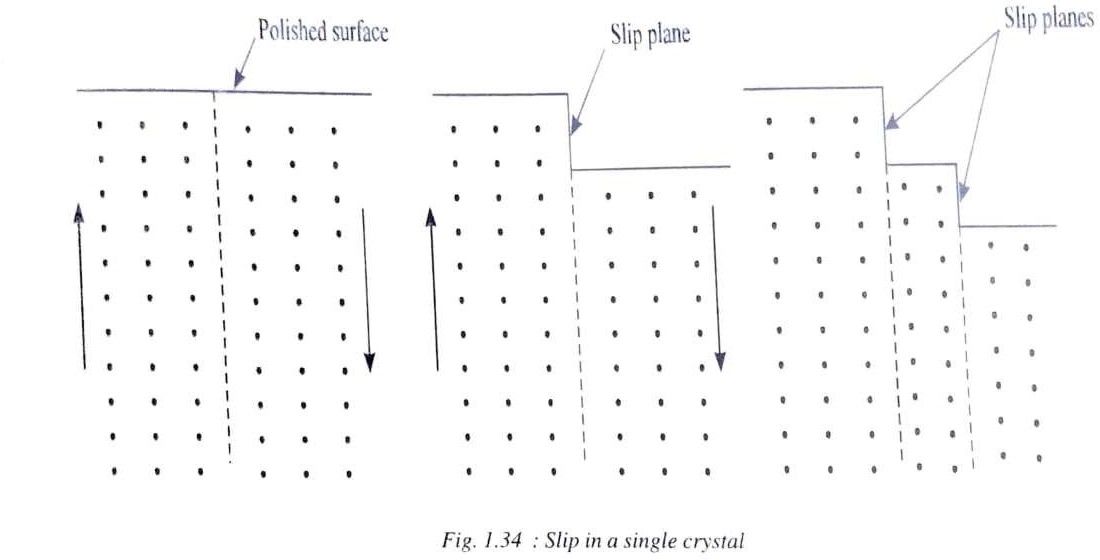
When a single crystal in tension is stressed beyond its elastic limit, a step appears such that the single crystal divides into two blocks and one block moves with respect to other (fig 1.34).
This is due to pure shearing stress that are acting across the specimen irrespective of whether the crystal is subjected to tensile or compressive stresses.
When the tensile load is further increased, the blocksbecome again divided and relative displacement takes place. Slip can be imagined to a pack of playing cards when they are shuffled.
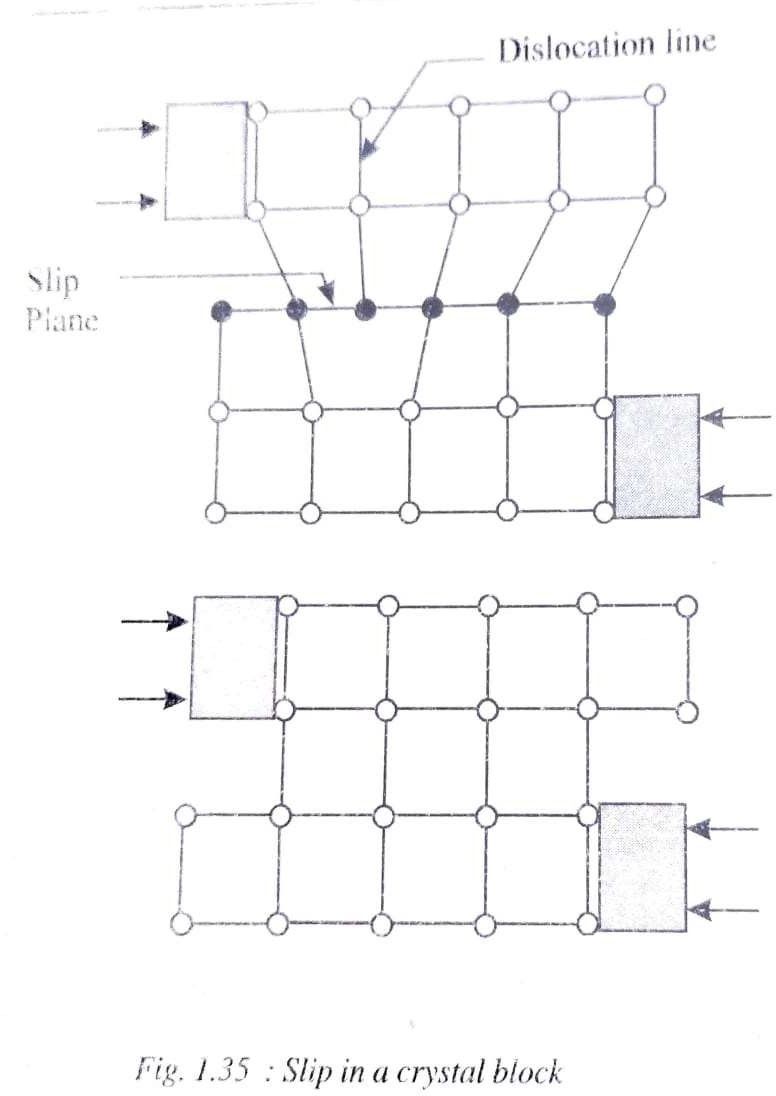
Slip occurs due to the movement of dislocations throughthe crystal as shown in fig 1.35.
(ii) Plastic deformation by Twinning:
This is the second important mechanism by which metals plastically deform. In twinning each plane of atoms move through a definite distance in the same direction.
The extent of movement of each plane is proportional to its distance and in the same direction.
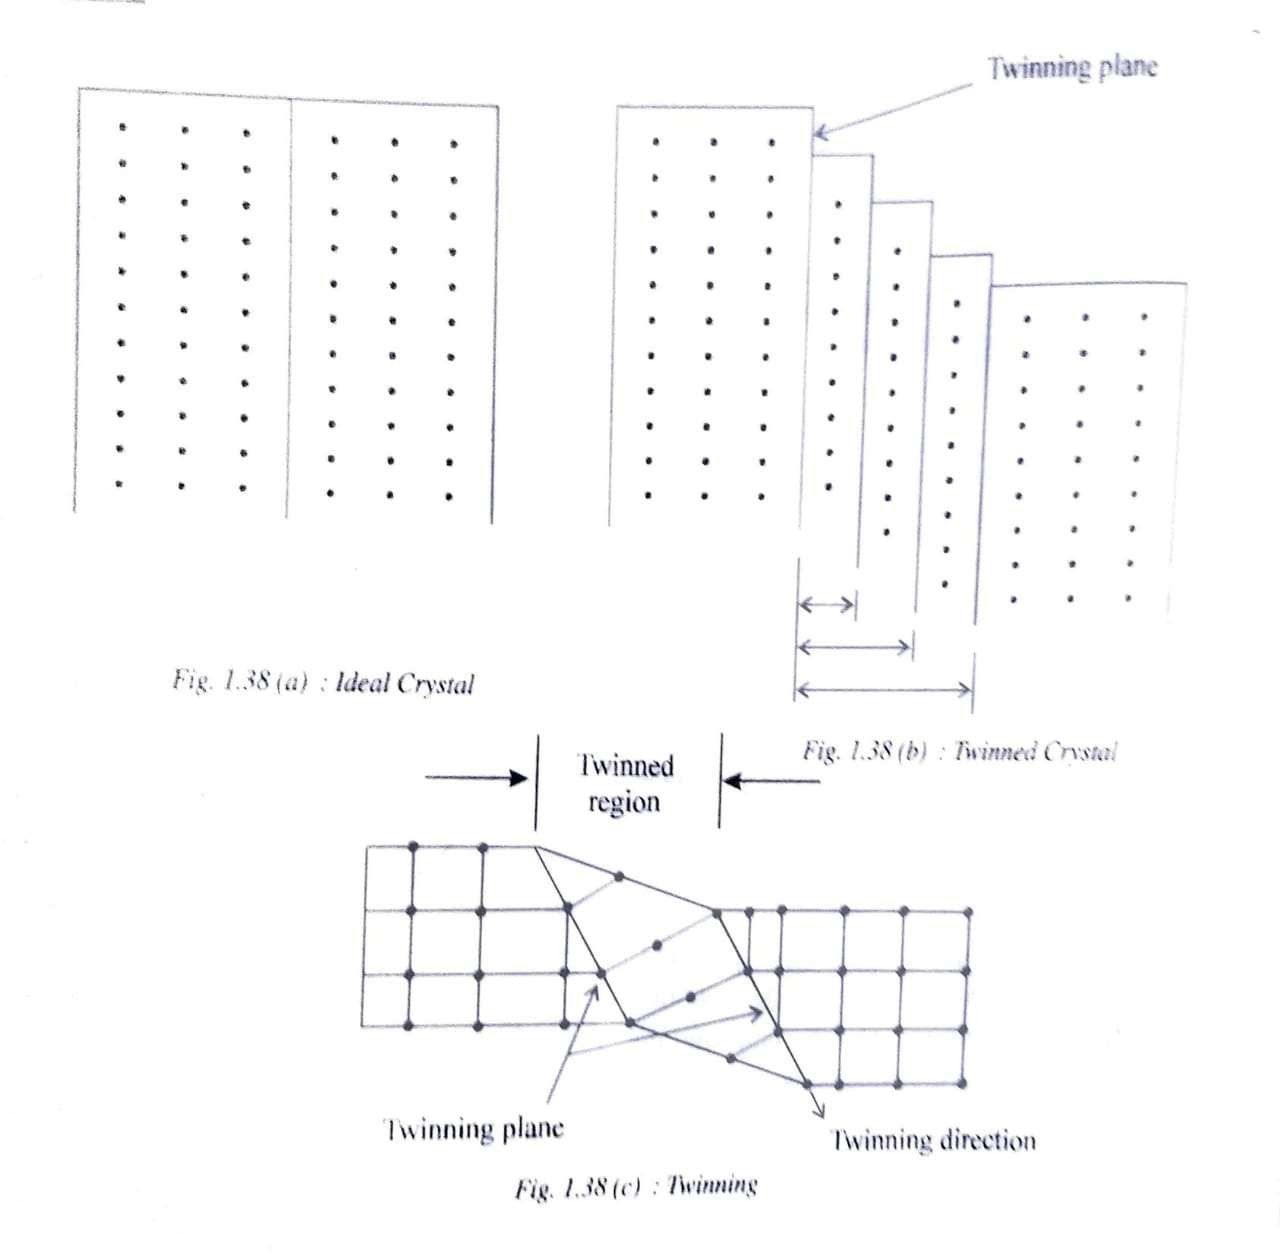
The extent of movement of each plane is proportional to its distance from the twinning plane, as shown in fig 1.38 (b).
The distance moved by each successive atomic plane is greater than the previous plane by a few atomic spacings.
The twinning plane is perpendicular to the paper.
When a shear stress is applied, the crystal will turn about the twinning plane in such a way that the region to the left of the twinning plane is not deformed whereas the region to the right(twinned region) is deformed.
The atomic arrangement on either side of the twinned plane is in such a way that they are mirror reflections of each other.
Twins are known as Annealing twins when they are produced during annealing heat treatment and mechanical twins when they are produced during mechanical deformation of metals.
Twinning also occurs on definite crystallographic planes and directions.
Differentiate between Slip and Twinning
|
Slip |
Twinning |
|
1. All atoms in one
block move over the same fractional distance depending on their plane |
Different planes of atoms move fractional distances depending on their plane. |
|
2.
Slip appears as thin lines broad or bands |
They appear as broad lines or bands |
|
3. There is very
little change in lattice orientation |
Lattice orientation changes in the twinned
region |
|
4.
Requires lower shear
stress |
Requires higher
shear stress |
|
5. Occurs in metals having more number of slip
systems Ex- Cu (FCC)
(12 slip systems) |
Occurs in metals having less numbers of slip
systems. Ex- Zn (HCP) (3 slip system) |
|
6. More pronounced at higher temperatures and gradual holdings |
More pronounced at low temperatures and impact holdings |
Stress - Strain Diagrams showing Ductile &Brittle Behavior
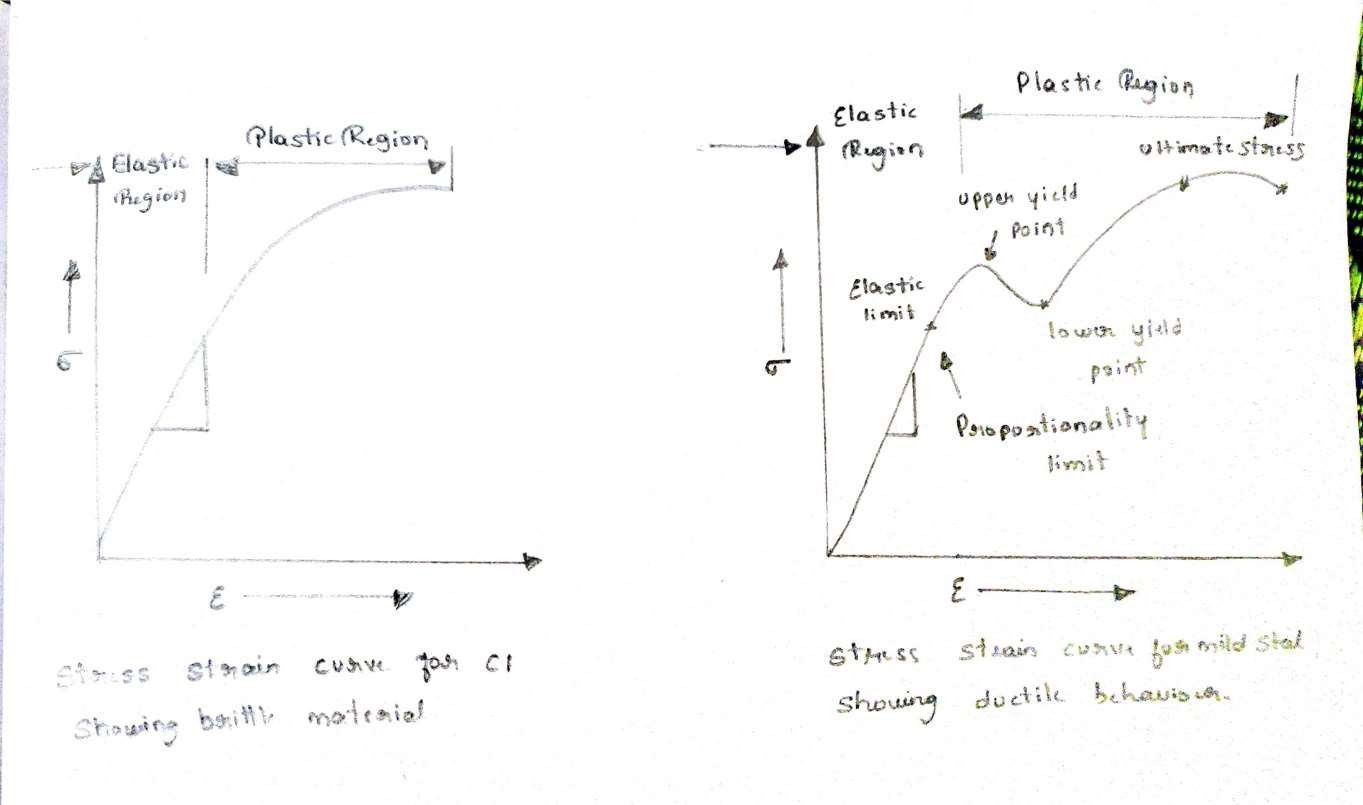
Elastic Region:
Linear Elastic behavior (Proportionality Limit):
When stress is proportional to strain in the elastic region i.e., if the stress-strain relationship is linear(a straight line) then it is known as linear elastic behavior.
Stiffness (Elastic Limit):
Stiffness is defined as the resistance offered by the material to elastic deformation.
In this material can take maximum stress without any permanent deformation Materials having high stiffness show less elastic deformation under load.
The modulus of elasticity or the Young's Modulus (E) itself is the measure of stiffness of a material.
Stiffness (Elastic Limit) is also measured as the slope of the linear portionof the elastic regionon a stress strain diagram
Elastic Strength (Upper Yield Point):
Elastic Strength corresponds to the highest stress at which the behavior of the material remains elastic. In other words, itis minimum stress at which plastic deformation first occurs.
End of elastic Region:
At the end of elastic region either of the two things might occur – fracture or yielding.
The specimen might break immediately after the elastic limit in case it is a brittle material or the specimen might start yielding as in case of a ductile material.
(Note - If the question is asked for brittle material or cast iron. Write the answer till here and write fracture strength)
Plastic Range:
Yield Strength (Lower Yield Point):
Yield strength can be defined as the stress at which plastic deformation (yielding) begins without any appreciable increase in load.
A simple difference between elastic strength and yield strength is that Hooke's Law may still be obeyed at the elastic limit whereas the law is not obeyed at the yield point
Offset Yield Strength:
Some materials like mild steel exhibit a definite yield point and hence have a definite yield strength while some other materials like cast iron do not have a definite yield point. So, for such materials which do not exhibit a definite yield point, a quantity called Offset yield strength is determined.
Ultimate tensile strength:
After the yield point on the stress - strain curve the specimen undergoes continuous plastic deformation with increasing load.
This load reaches a certain maximum value after which the specimen does not take any more load. At the point of ultimate load, the area of cross section of stress that specimen starts reducing considerably and is known as necking.
Fracture strength:
After the ultimate load is reached, the load drops and at a particular load, fracture takes place.
The stress corresponding to this load, where the actual failuretakes place, is known as the fracture strength of the material.
Additional:
Resilience:
Resilience is the ability of the material to absorb energy when it is loaded elastically and give back the same energy when the load is removed. So as long as the body remains loaded, it contains stored energy within itself which is called the Strain Energy. As soon as the load is removed, the stored energy is given back, exactly as is observed in a spring.
Ductility:
Ductility is the ability of the material to undergo plastic deformation under tensile load.
In other words, ductility is that property of a material by which it can be drawn into thin wires Example - Copper
Malleability:
Malleability is the ability of the material to undergo plastic deformation under compressive load.
In other words, malleability is that property of the material by which it can be flattened into thin sheets without cracking.
Example – lead
Toughness:
The toughness of a material is its ability to withstand both elastic and plastic deformation.
In other words, it is the amount of energy a material can withstand before fracture takes place.
For example - If a sudden load is applied to a piece of mild steel and then to a piece of glass, the mild steel piece will absorb more energy before breaking. Thus mild steel is said to have a higher toughness than glass.
Fracture
Fracture is the separation or fragmentation of a solid body into two or more parts under the action of load.
During fracture atomic bonds are broken and new surfacesare formed
Types of Fracture
Fractures are broadly classified into
(i) Ductile or type I fracture
(ii) Brittle or type II fracture
(iii) Shear or type III fracture
i) Ductile fracture or type I fracture
It is characterized by an appreciable amount of plastic deformation. The fracture proceeds relatively slowly and the fracture surface is dull in appearance. Ductile fracture is of two types:
a) Highly ductile fracture-
In these the material necks down to a point fracture and yields to 100% reduction in cross section area. ex - soft metals like pure gold, lead etc.
b) Moderately ductile fracture or Cup and Cone Fracture–
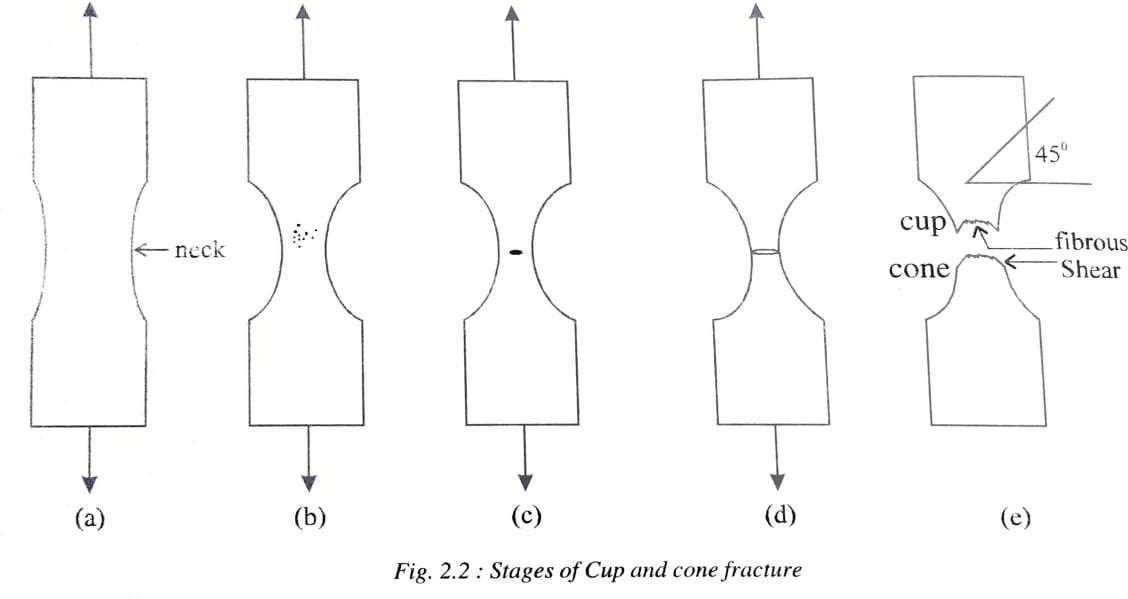
Stage
(a) - Initial Necking or reduction in cross - sectional area take place.
(b) - Small cavities or voids form in the interior of the cross section
(c) - As load is increased these minute cavities join together to form an elliptical crack which has its long axis perpendicular to the direction of load.
(d) - The crack continues to grow in a direction parallel to its major axis.
(e) - Finally, fracture results due to rapid proportion of the crack
(ii) Brittle fracture or Type II fracture
Like in ductile fracture, here also small cavities join together to form a crack and this crack propagates. But all these stages happen instantly, and the material failure takes place suddenly
Tendency for brittle fracture is increased with
a) decreasing temperature
b) increasing strain rate or rate of loading
c) tri-axial stress conditions usually produced by a notch
There are two types of Brittle Fracture -
(i) Intergranular fracture: In this the crack propagates along the grain boundaries and fracture occurs.
(ii) Intragranular fracture: In this the fracture crack passes through the grains and the fractures surface looks granular. This also known as Trans granular fracture.
Note - Inter and Intra
(iii) Shear Fracture or Type III Fracture
This type of fracture is found in ductile single crystals.
This is promoted by shear stresses and occurs as a result of extensive slip on the active slip plane.
Fracture surfaces are normally at 45 degree to the direction of tensile load and appears shiny owing to extensive slip between fracture.
Creep
Creep and Description of the Phenomenon
When materials under several service conditions are required to sustain steady loads for long periods of time, they undergo a time dependent deformation. This is known as creep and can also be defined as ‘the slow and progressive deformation of a material with time at constant stress’.
In other words, creep deformation refers to that permanent deformation which occurs in materials that are exposed to lower values of stress (< elastic limit) but for a prolonged length of time.
Creep in most of the materials, however, is found to occur predominantly at higher temperatures than at lower temperatures. Generally, temperatures above 0.4 Tm (Tm = Melting temperature) are considered as higher temperatures.
Therefore, the study of creep is very important for those which are used at higher temperatures like components of gas turbine, furnaces, rockets, missiles etc.
But there are exceptions like lead and plastic which undergo creep at room temperature also.
At elevated temperature, the tensile properties of most engineering metals are very sensitive to both strain rate and time of exposure than at lower temperatures.
Alternatively, creep is also set to occur at higher homologous temperatures.
Three stages of Creep - Through Creep Curve
The creep curve is obtained by applying a constant tensile load below the yield point to a specimen maintained at constant temperature.
The strain or the elongation of the specimen is then determined as a function of time.
For example, led is said to creep at room temperature since its melting temperature is 200 degree Celsius. i.e., T/Tm = 298/473 = 0.63

As soon as the specimen is loaded, there will be an instantaneous strain which is denotedε0 on the creep curve.
Further deformation of the metal only after the instantaneous strain is considered as 'creep deformation'.
Creep deformation of materials up to failures are divided into 3 stages:
(i) Primary creep
(ii) Secondary creep
(iii) Teritary creep
(i) Primary Creep: Thus, is the first stage of the creep which represents a region of decreasing creep rate. In this region the rate at which the material deforms decreases with time until it reaches a constant value.
The creep rate goes on reducing because as the metal deforms it undergoes strain hardening and offers more and more resistance to further elongation. Primary creep is predominantly a period of transient creep.
Primary Creep is important for those materials which undergo creep at room temperature.
(ii) Secondary Creep: This stage is a period of nearly constant creep rate. The creep rate is constant because 'strain-hardening' and 'recovery effects’ balance each other.
This is an important part of the curve because most of the working components will be in this state.
Secondary creep is also known as steady state creep. Creep in this region takes place by the viscous flow in the materials.
(iii) Teritiary Creep:
This stage is a period of increasing strain rate. Teritiary creep occurs when there is an effective reduction in cross- section are due to necking or internal void formation. So, the stress at that cross-section increases and consequently the value of strain also increases at a faster rate before the occurrence of fracture.
If the stress is kept constant instead of the load or if the true strain is taken into consideration, then the resulting fracture due to creep would be at 'B'.
Creep Properties
(i) Creep Strength:
It is defined as "the highest stress that a material can withstand without excessive deformation for a specified length of time".
It is also known as 'Creep limit'.
ex. Creep Strength for a steam turbine blade may be that stress which will produce just 0.2% creep for 10,000 hours of working at 800 degree.
(ii) Creep Rupture Strength:
It is defined as "the highest stress that a material can withstand without rupture for a specified length of time".
ex. For the same turbine blade the rupture strength is that stress which produces a fracture in 10,000 hours at 800 degree Celsius. Creep rupture strength is also known as "Stress - rupture strength" or simply rupture strength".
Stress Relaxation
Stress relaxation is the time dependent decrease in stress acting on a body which is constrained to a certain fixed deformation. In other words, it is the reduction in the value of the stress in those components which are not allowed to elongate.
Stress relaxation takes place in a member will reduce after long periods of time.
Fatigue
Fatigue is defined as a process of progressive localized plastic deformation occurring in a material subjected to cyclic stresses and strains at high stress concentration locations that may culminate in cracks or complete fracture after a sufficient number of fluctuations.
Type of Fatigue loading with examples
(i) Completely reversed cycles of stress:
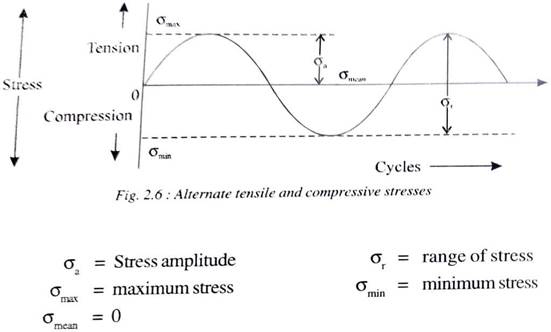
Fig 2.6 illustrates the type of fatigue loading where a member is subjected to opposite loads alternatively with a mean of zero.
For example, bending of steel wire continuously in either directions lead to alternate tensile and compressive stresses on its surface layers and failure by fatigue.
(ii) Repeated stress cycles:

Fig shows the type of fatigue loading where a member is subjected to only tension but to various degrees.
A spring subjected to repeated tension as in a toy would lead to fatigue failure
(iii) Irregular or Random stress cycle:

Fig 2.8 shows a type of fatigue loading where a member could be subjected to irregular loads just as in the case of an aircraft wing subjected to wind loads
Stages of fatigue failure
(this section can also be referred for Mechanisms of fatigue (failure))
Let us consider a ductile material which is subjected to simple alternating tensile and compressive stresses.
Failure by fatigue is found to take place in three stages:
(i) Crack nucleation (ii) Crack Growth(iii) Fracture
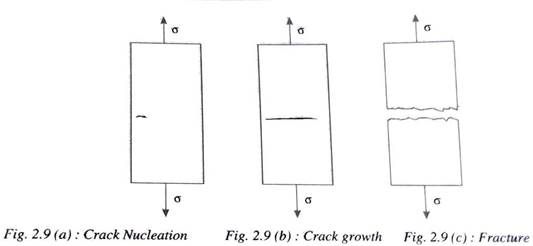
(i) Crack nucleation:
During the first few cycles of loading, localized changes take place in the structure at various places within the material.
These changes lead to the formation of submicroscopic cracks. These cracks are usually formed at the surface of the specimen.
(ii) Crack Growth:
The submicroscopic cracks formed grow as the cycles of loading continue and become microscopic cracks.
(iii) Fracture:
When Critical size is reached the crack propagates. The area of cross-section supporting the load gets reduced thus increasing the stress value and fracture finally occurs.
Fatigue testing
Fatigue failures in engineering materials are observed by conducting the fatigue test which involves the plotting of an S-N diagram. One suck test is the R R Moore reversed -bending fatigue testing machine.
Specimens subjected to fatigue test are made to undergo fluctuating or opposite stresses one such test arrangement is shown in the fig. where the specimen is bent with the help of weights as well as rotated. By this, alternate tensile and compressive stresses are imposed on thevarious layers of the specimen.

A counter coupled to the motor counts the number of cycles to failure. The experiment could be conducted for different loads, and different number of cycles to fractures are noted to draw the S-N diagram.
S-N Diagrams
The S-N Curve which gives information on the fatigue behavior of a material is a plot of stress (S) against the number of cycles to failure (N). The value of stress that is plotted can be σa,σmax, σmin.
The values of N are usually taken along a log scale.

The S-N curve is plotted by applying a cyclic load at any particular value of stress and repeated continuously until the specimen fails. The number of cycles required for failure at that stress is plotted. Specimens would fail for different number of cycles when held at different stresses and hence a number of points are obtained. By joining all these points, a S-N curve typical of that material is obtained.
Fig 2.12 shows the S-N Curve for two metals-mild steel and an aluminum alloy. It is seen from the S-N curves for both metals that the number of cycles which a metal can endure before failure, increases with decreasing stress. But in the case of mild steel, the S-N curve becomes horizontal at a certain limiting stress. Below this limiting stress called fatigue limit or endurance limit. the material can endure an infinite number of cycles. without failure. This means that if the stress is below the materials will never fail for any number of cycles of stresses.
In the case of the non-ferrous aluminum alloy, the S-N curve slopes gradually downward with increasing number of cycles. This material does not have a true fatigue limit because the S-N curve never becomes horizontal.
Fatigue Properties
1) Fatigue Life (N):
It is the total number of cycles required to bring about final fracture in a specimen at a given stress.
Fatigue life for a given condition is a property of the individual specimen and is arrived at after testing a number of specimens at the same stress.
2) Fatigue Life for P percent survival (Np):
It is the fatigue life for which P percent of the population of samples tested have a longer life than the rest.
For example, N90 is the fatigue life for which 90% of the samples would be expected to survive and 10% to fail ata particular stress.
3) Median Fatigue Life:
It is the fatigue life for which 50% of the population of samples fail and the others 50% survive at a particular stress.
4) Fatigue Strength (σn): It is the stress at which a material can withstand repeatedly 'N: number of cycles before failure. In other words, it is the strength of a material for a particular fatigue life.
5) Fatigue Limit or Endurance Limit (σE): It is the stress below which a material will not fail for any number of cycles.
For ferrous materials it is approximately half of the ultimate tensile strength
For non-ferrous metals since there is no fatigue limit is taken to be the stress at which it endures 'N' number of cycles without failure.
'N' is usually taken as 5x10^8 cycles for non-ferrous metals.
Factors affecting Fatigue Life
1) Effect of stress concentration on fatigue:
Stress concentrations are actually responsible for the majority of fatigue failures occurring in practice.
All machine elements contain stress raisers like fillets, keyways, screw threads, porosity etc. Fatigue cracks are nucleated in the region of such geometrical irregularities.
Fatigue failure by stress concentration can be minimized by reducing the avoidable stress - raisers through careful design and the prevention of stress raisers by careful machining and fabrication.
2) Size Effect:
Experiments have shown that fatigue strength of large members is lower than that of small specimens. This may be due to two reasons:
(i) The larger member will have a larger distribution of weak points than the smaller one and on average, fails at a lower stress.
(ii) Larger members have larger surface areas. This is important because the imperfections that cause fatigue failure are usually at the surface.
3) Surface Roughness
Practically almost all fatigue cracks nucleate at the surface of the members. Therefore, the conditions of the surface such as surface roughness and surface oxidation or corrosion are very important.
Experiments have shown that different surface finishes of the same material can appreciably affect fatigue performance. Smoothly polished specimens have higher fatigue strengths.


